Creating manual statistics
Use a manual statistic to add your own data to a general ledger (GL). First, you'll add the manual statistic, where you add the parameters for the statistic. Then, you'll manually enter the data for your manual statistic in the GL.
As an example, we'll create a manual statistic that lists the square footage used by each department that occupies a single location. This statistic can be used later to determine the real estate costs for each department, based on how much physical space used as part of the total rental cost for the location.
To add a manual statistic:
-
From the Home page, launch the command center.
-
Select Financial Reporting.
-
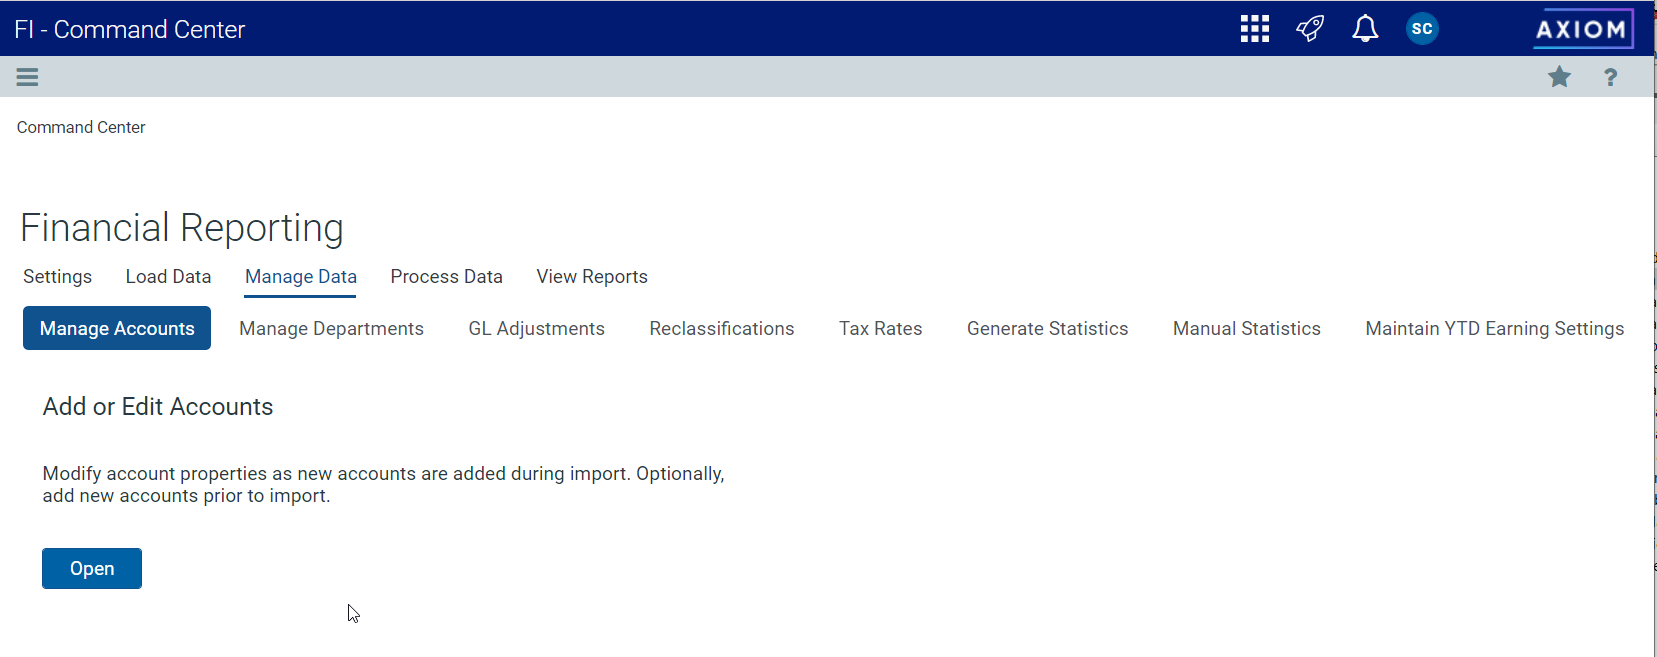
Click Manage Data on the Financial Reporting page.

Click image to view full size
-
Click Manual Statistics. The Manual Statistics page opens.
-
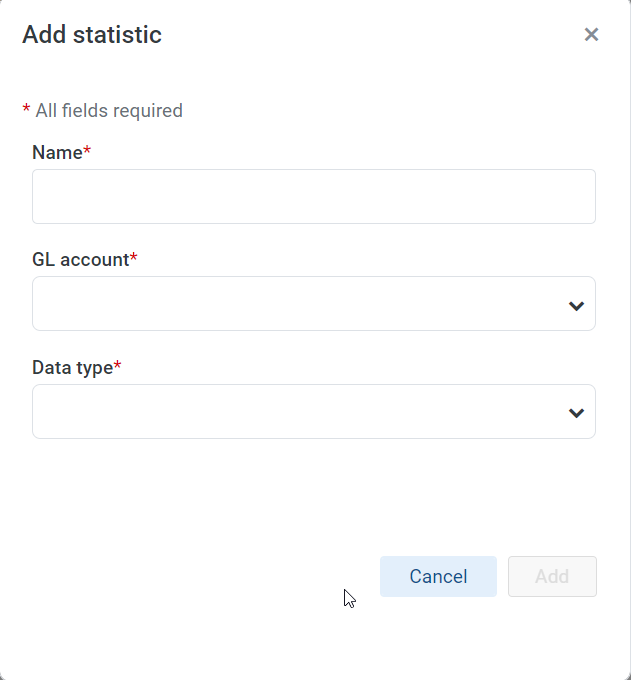
Click the Add Statistic button. The Add statistic form opens.

Click image to view full size
-
Enter a name for this statistic.
-
Select the GL account that will contain this statistic.
NOTE: This is the account that you will use when you manually add data to your manual statistics. You can use the value to filter in the GL to view your values.
-
Select the data type for this statistic, which can be average (AVG), end of month (EOM) or month to date (MTD).
-
Click Add. A spreadsheet opens, where you can enter data for one or more months.

Click image to view full size
-
Optionally, you can add a filters to control which departments to apply the manual statistics to. See Using filters for a manual statistic below.
-
When you are finished adding data and creating filters, click Save.

To use filters for a manual statistic
-
From the initial spreadsheet for your manual statistics, click the Add filters control
 for a group, such as Department. The Filter Wizard opens.
Click image to view full size
-
Use the criteria controls to define the criteria for the statistic.
TIP: Use the search boxes to help you locate values more quickly.
NOTE: The criteria selector offers several operations: equals, does not equal, less than, less than or equal to, greater than, and greater than or equal to.
-
Press Enter to view a preview of the values that will be used for your statistic. You can click the
 to remove the settings and let you define the criteria again.
 -
Click the
 Apply button to add your criteria to the Filter box.
 -
Click OK to save your statistic. The spreadsheet displays, showing the results of the filter.
Click image to view full size


To add data to a manual statistic"
-
From the Financial Reporting page, select Manage Data, then select Manual Statistics.
-
Click on the name of your statistic to open its spreadsheet.
-
Add data for the month to the spreadsheet and click the Save button.
To view the manual statistic in the GL:
-
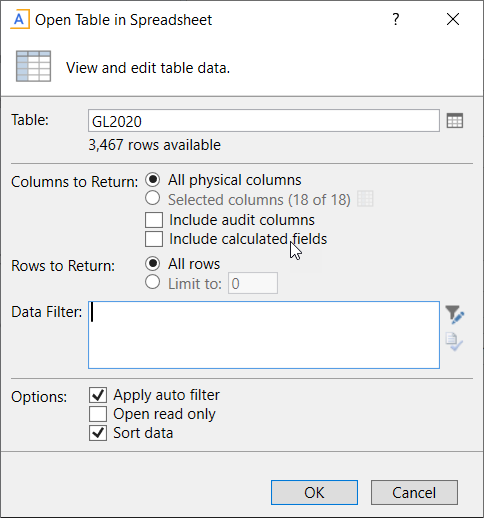
From the Excel client, open the GL that contains your manual statistic. The Open Table in Spreadsheet dialog box opens.

Click image to view full size
-
Click the Filter icon next beside the Data Filter box.
-
Use the Filter Wizard to select the account.
-
Click Apply and then click OK.
-
The spreadsheet displays, showing just the data for that account. You may need to click the Refresh Spreadsheet button to view the data.

Click image to view full size
The Detail description column will identify the statistics as Manually added statistic.
